갤러리Gallery
역사적으로 중요한 시각화 작품과 Information is Beautiful Awards 수상작을 큐레이션한 컬렉션.A curated collection of landmark visualizations and Information is Beautiful Awards winners.
고전Historic Canon
20플레이페어부터 D3.js까지, 데이터 시각화의 역사를 바꾼 작품을 연대순으로 소개합니다.From Playfair to D3.js: the works that changed the history of data visualization, in chronological order.
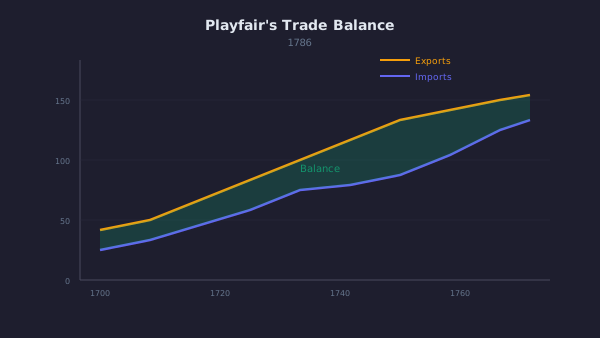
The Commercial and Political Atlas
William Playfair · 1786
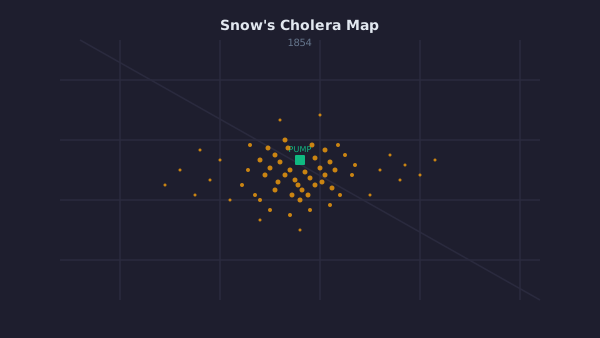
Broad Street Cholera Map
John Snow · 1854
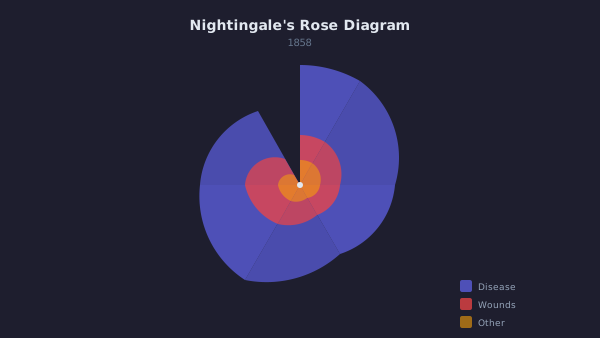
Diagram of the Causes of Mortality in the Army in the East
Florence Nightingale · 1858
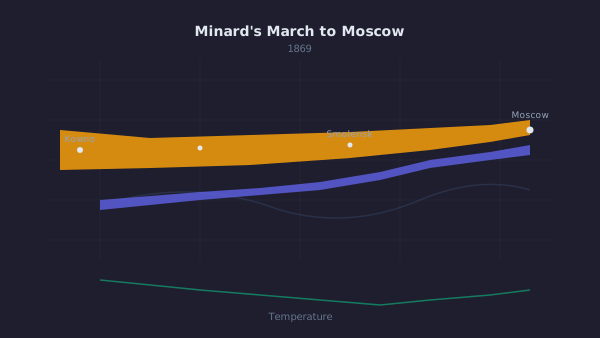
Napoleon's March to Moscow
Charles Joseph Minard · 1869
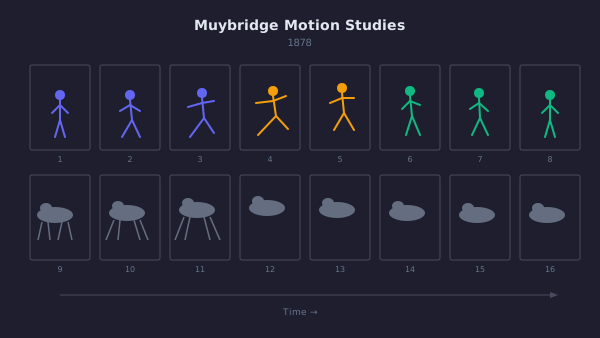
The Horse in Motion
Eadweard Muybridge · 1878
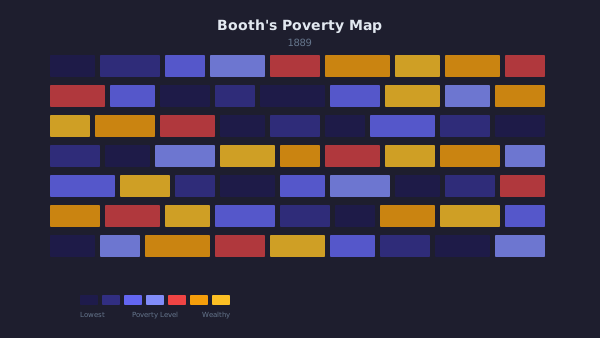
Descriptive Map of London Poverty
Charles Booth · 1889
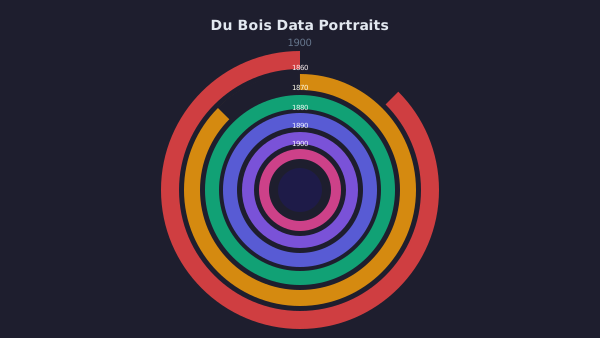
Data Portraits of African Americans
W.E.B. Du Bois · 1900
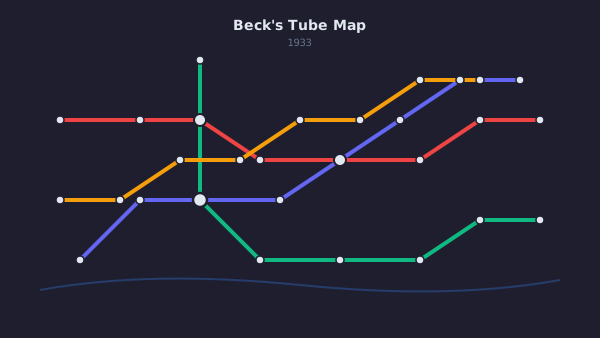
London Underground Map
Harry Beck · 1933
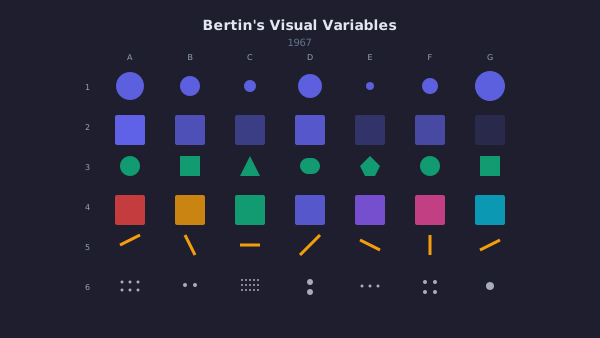
Semiology of Graphics
Jacques Bertin · 1967
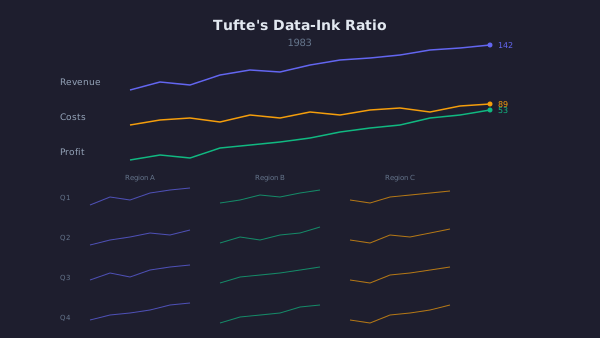
The Visual Display of Quantitative Information
Edward Tufte · 1983
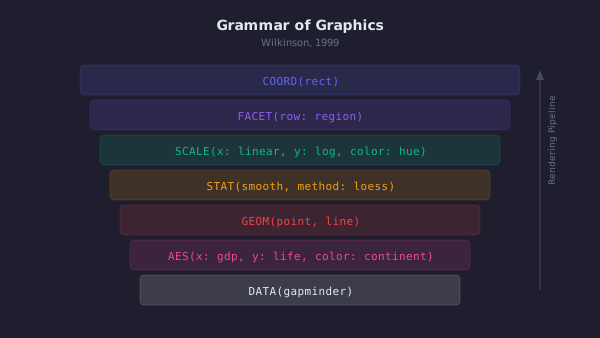
The Grammar of Graphics
Leland Wilkinson · 1999
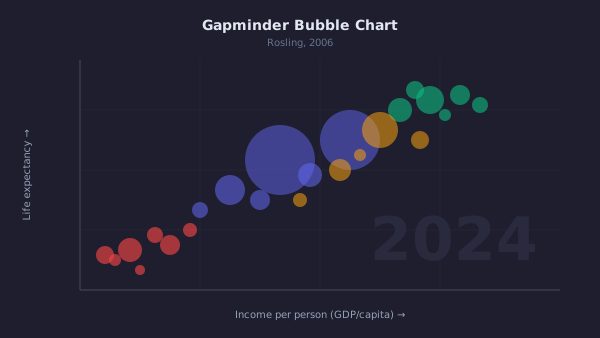
Wealth & Health of Nations
Hans Rosling / Gapminder · 2006

D3: Data-Driven Documents
Mike Bostock · 2011
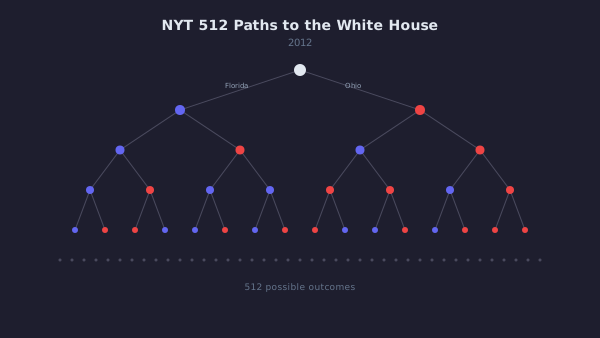
512 Paths to the White House
Mike Bostock / New York Times · 2012
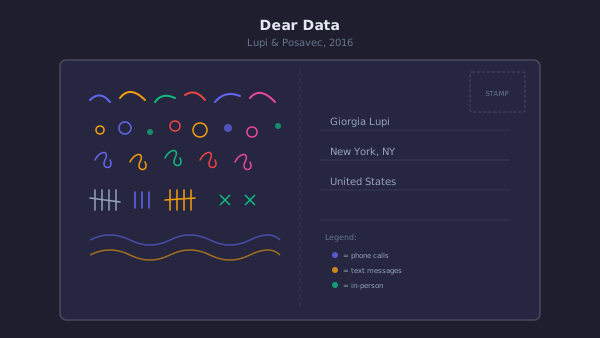
Dear Data
Giorgia Lupi & Stefanie Posavec · 2015
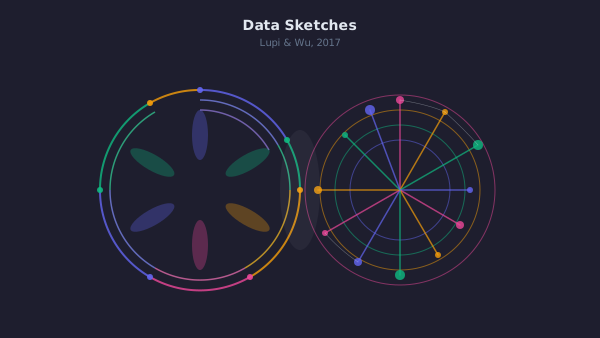
Data Sketches
Nadieh Bremer & Shirley Wu · 2017
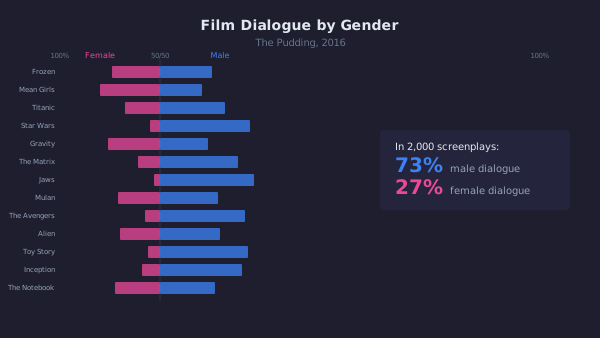
Film Dialogue from 2,000 Screenplays
The Pudding · 2017
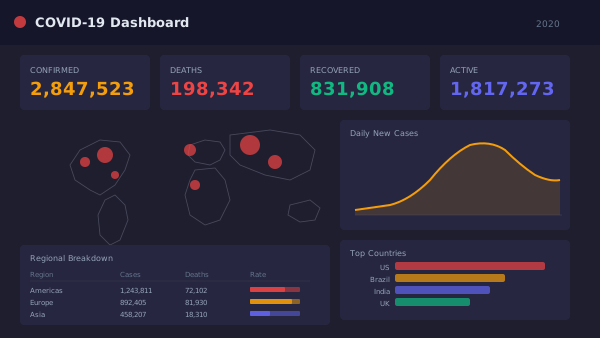
COVID-19 Dashboard
Johns Hopkins University · 2020
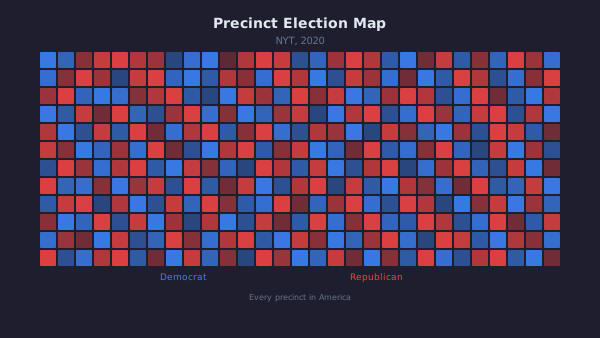
An Extremely Detailed Map of the 2020 Election
New York Times · 2021
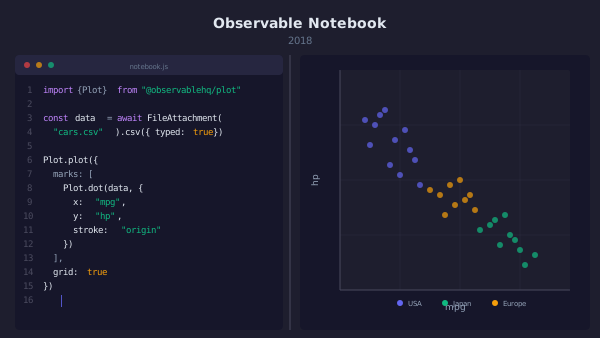
Observable Framework
Mike Bostock / Observable · 2024
IIB 수상작IIB Awards
100Information is Beautiful Awards 수상작(2019년부터 2024년까지). 필터와 검색으로 찾아보세요.Information is Beautiful Awards winners, 2019 to 2024. Browse with filters and search.
100개 작품100 entries
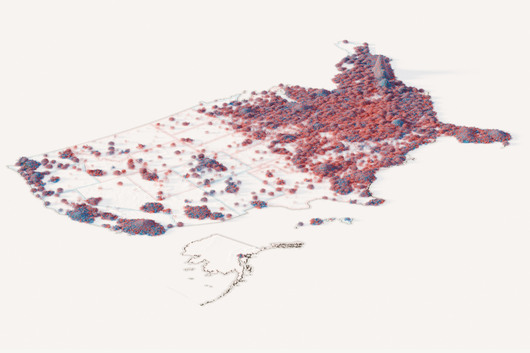
How the 2024 U.S. election was decided, vote by vote
은상The Washington Post · 2024 · 시사와 정치
It shows how mapping each unit as a particle can convey scale and distribution at once.
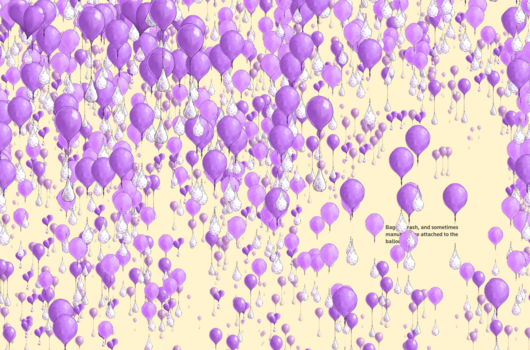
A torrent of trash
동상Sudev Kiyada, Han Huang, Adolfo Arranz, Simon Scarr (Reuters) · 2024 · 시사와 정치
It shows how an immersive format can convey scale and distance in a news story.
Beyond Crisis: Lives Saved
동상MICA · 2024 · 과학, 기술, 건강
It shows how accessibility and a human-centred narrative can be built into a data story.
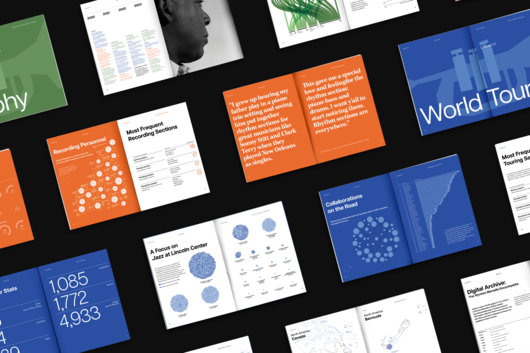
Beyond the Score - Wynton Marsalis' Musical Legacy Visualized
동상Emanuele Pizzuti · 2024 · 예술, 엔터테인먼트, 문화
It shows how data cleaning and structure can drive both the narrative and the layout of a printed book.
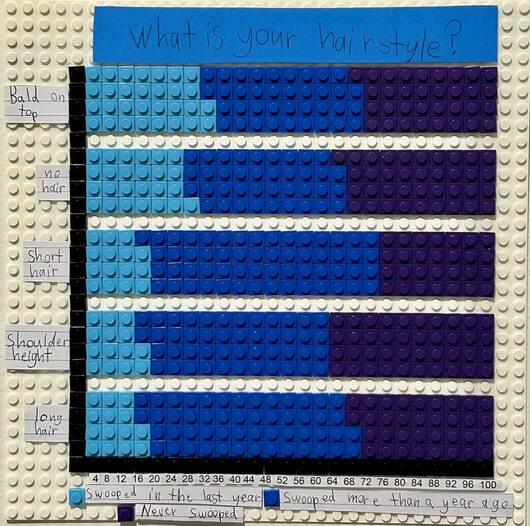
Born to be wild: An investigation into Australian magpie swooping
최종 후보The Magpie Kid (Blue Mountains, NSW) · 2024 · 이색
It shows that a handmade physical encoding can make survey percentages clear and memorable.
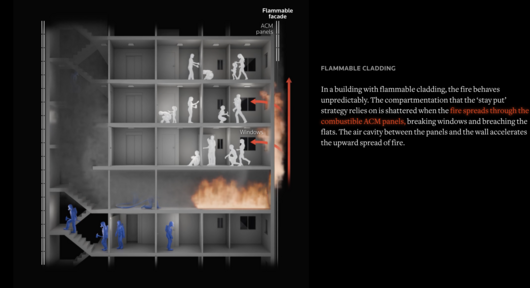
Buildings wrapped in solid gasoline
동상Reuters · 2024 · 장소, 공간, 환경
It shows how explanatory graphics can make a hidden physical mechanism understandable inside a news story.
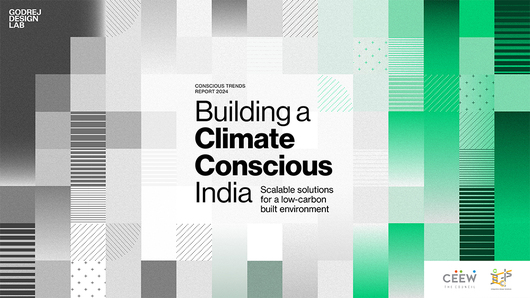
'Building a Climate Conscious India': Conscious Trends Report, 2024
은상Revisual Labs · 2024 · 장소, 공간, 환경
It shows how a consistent visual language can carry a long data report for a broad audience.
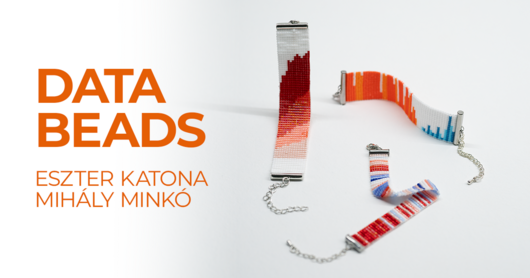
Databeads
은상Databeads · 2024 · 예술, 엔터테인먼트, 문화
It shows that a data encoding can live in a physical, wearable medium and still invite conversation.
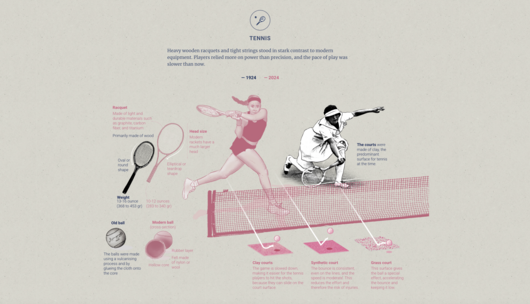
Games of two eras
동상Marcelo Duhalde · 2024 · 여가, 게임, 스포츠
It shows how a deliberate color and texture choice can carry a historical comparison.
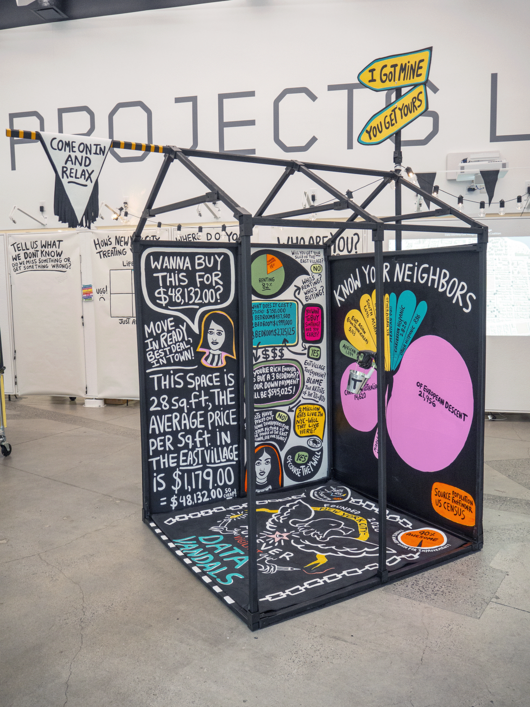
Hello From The Data Vandals (or free as air and water, or whatsoever things are true)
동상Jason Forrest · 2024 · 이색
A useful example of data visualization moving off the screen into physical space and public conversation.
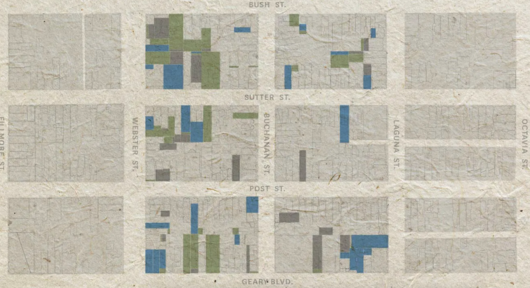
How San Francisco’s Japantown was devastated by mass incarceration
최종 후보San Francisco Chronicle · 2024 · 사람, 언어, 정체성
It shows how archival data and personal testimony can be combined to quantify a community's loss.
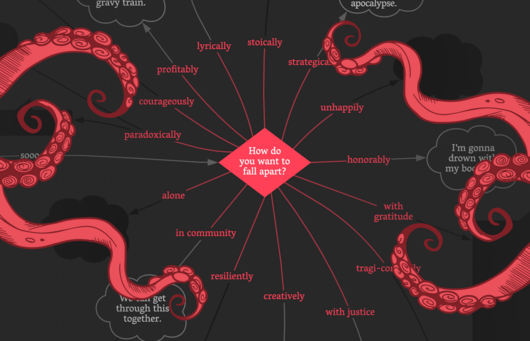
I Want a Better Catastrophe: A Flowchart for Navigating our Climate Predicament
금상University of Applied Sciences Potsdam · 2024 · 장소, 공간, 환경
A useful case of reworking a print flowchart into a narrated, explorable digital form.
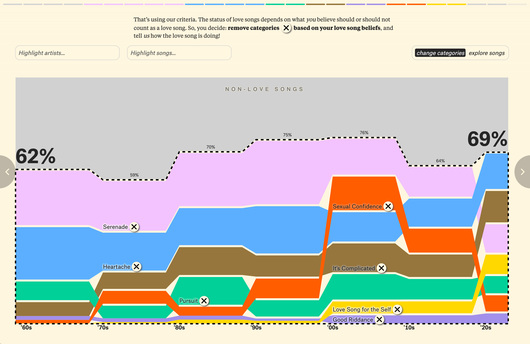
Is the Love Song Dying?
금상David Mora & Michelle Jia, working with The Pudding · 2024 · 예술, 엔터테인먼트, 문화
A good model for turning a cultural hunch into a testable data question.
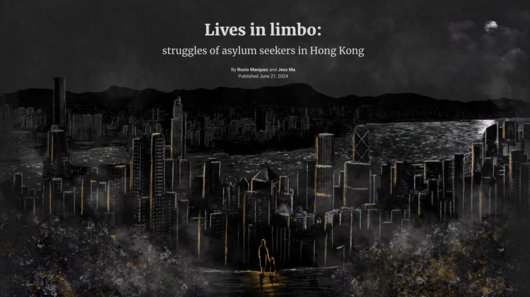
Lives in limbo: struggles of asylum seekers in Hong Kong
동상Marcelo Duhalde · 2024 · 인도주의
It shows how to combine hard figures with illustrated storytelling on a sensitive subject.
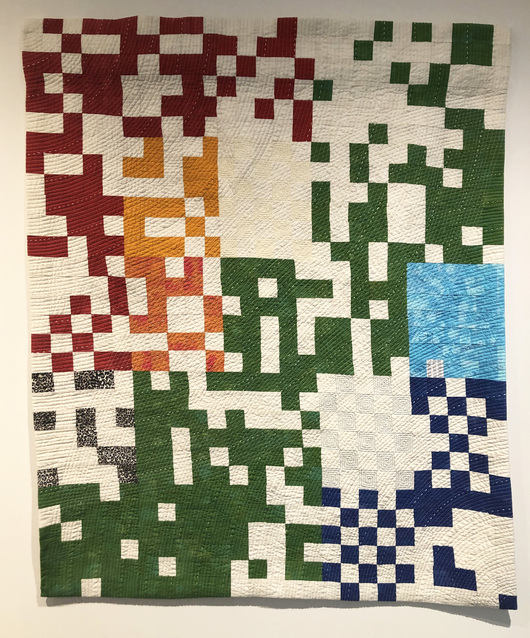
Material Interactions: Data-Driven Community Quilting
은상Syracuse University School of Information Studies · 2024 · 이색
It expands data representation into material form and collaborative making.
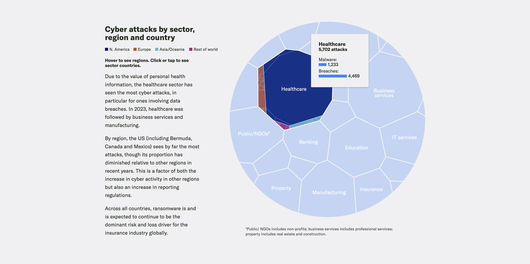
Moody's - 10 Major Risks Shaping Insurance Today Data Story
동상Moody's Corporation · 2024 · 비즈니스 분석
It shows how a long list of risks can be organized into one coherent story for a professional audience.
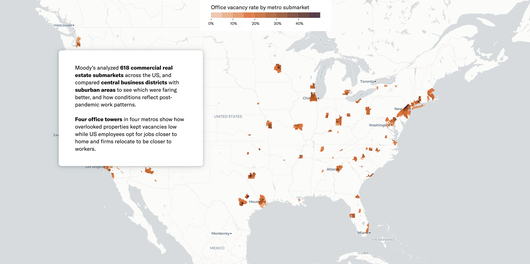
Moody's - Office Vacancies Data Story
금상Moody's Corporation · 2024 · 비즈니스 분석
A good example of turning a very large statistic into a relatable comparison within a broader argument.
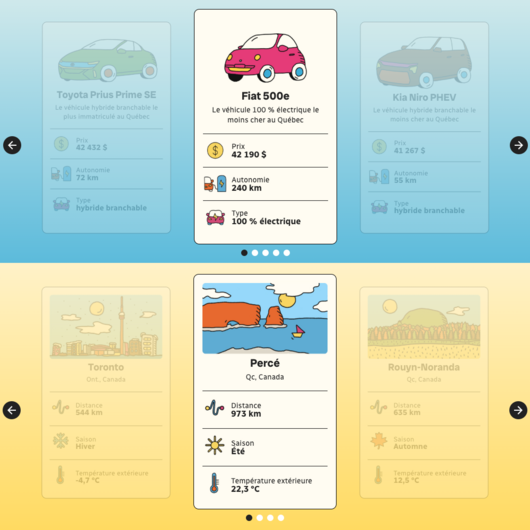
Navigate the obstacles to transportation electrification.
은상Radio-Canada · 2024 · 과학, 기술, 건강
A good example of explaining a complex policy issue to general readers through illustrated storytelling.
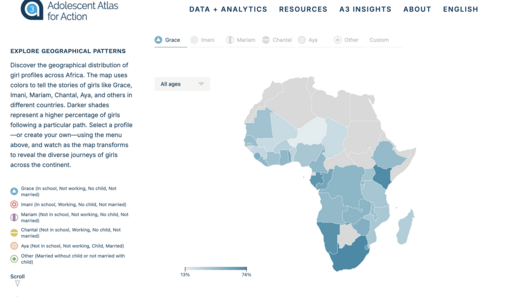
Pathways to Prosperity for Adolescent Girls in Africa.
은상OneTandem · 2024 · 인도주의
It shows how a few well-chosen indicators can carry a human-centered story.
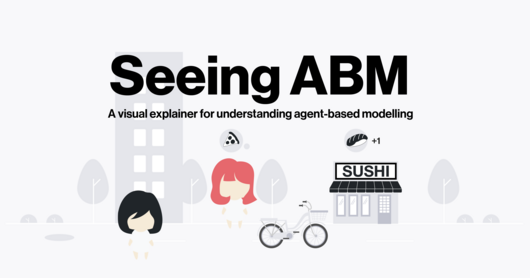
Seeing Agent-based Modelling
금상Liuhuaying Yang · 2024 · 과학, 기술, 건강
It shows how a fictional story and immediate feedback can make a complex simulation method approachable.

Seeking shadow. A cool fix for hot cities
은상Urbi Atlas · 2024 · 장소, 공간, 환경
It is a good example of weaving analysis, simulation and illustration into a single argument.
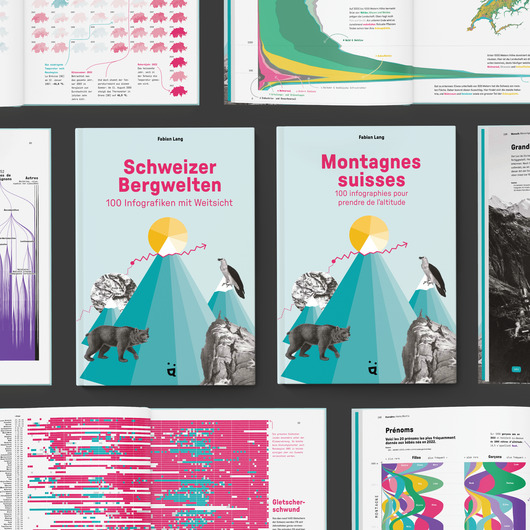
Swiss Mountains · Schweizer Bergwelten · Montagnes suisses
금상Fabian Lang · 2024 · 여가, 게임, 스포츠
It is a good example of weaving many topics into one cohesive printed work.

The Birdsong of Sorrow above Ukraine
금상Anastasia Balagurova · 2024 · 시사와 정치
A useful case for discussing how to design for empathy when the numbers are very large.
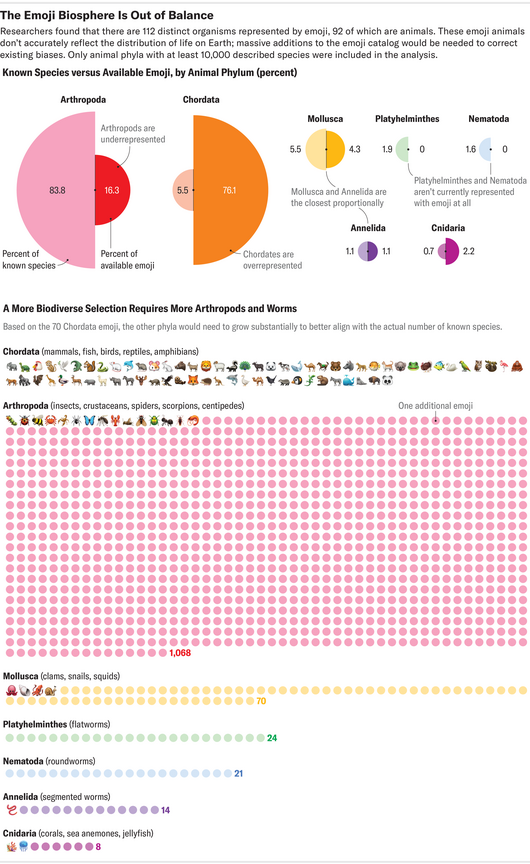
The Emoji Biosphere
최종 후보Scientific American · 2024 · 과학, 기술, 건강
A clear two-step comparison that moves from the observed gap to the size of the fix.

The Roots of Racism
은상Jack Beckwith · 2024 · 사람, 언어, 정체성
A useful example of pairing incident data with historical context in a mobile-friendly story.
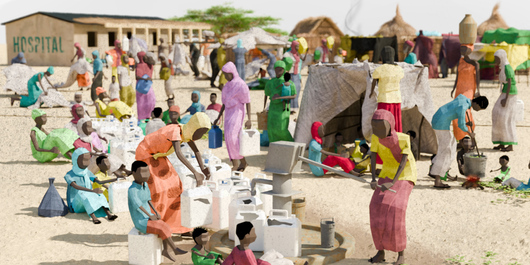
The world’s hunger watchdog warned of catastrophe in Sudan. Famine struck anyway.
금상Reuters · 2024 · 인도주의
It shows how a system-level failure can be explained through one place and its people.
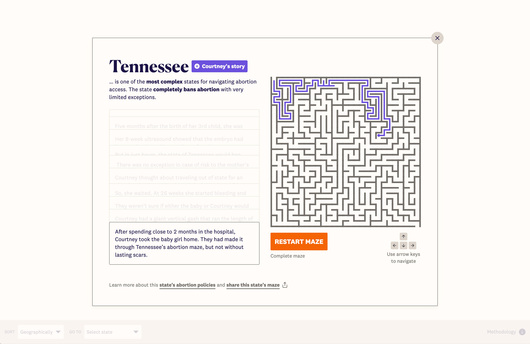
The United States of Abortion Mazes
금상Jan Diehm, Amber Thomas (The Pudding) · 2024 · 시사와 정치
It turns policy data into a metaphor readers can feel by navigating it.
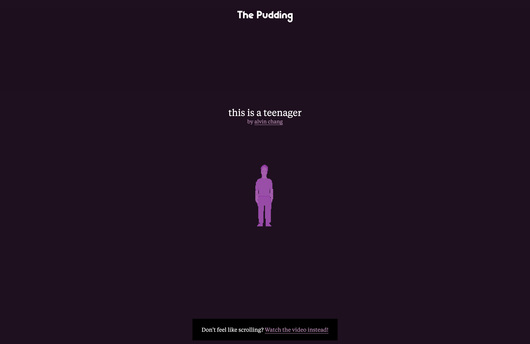
This is a Teenager
금상Alvin Chang, Jan Diehm, Amber Thomas (The Pudding) · 2024 · 사람, 언어, 정체성
It shows how a long-term story about many individuals can be told through watching change over time.
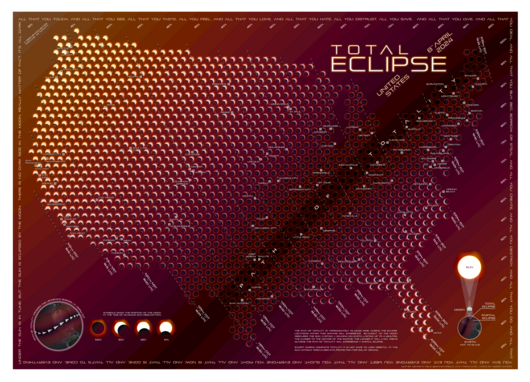
Total Eclipse
동상Kenneth Field · 2024 · 장소, 공간, 환경
It shows how small multiples and print finishing can work together as one encoding.
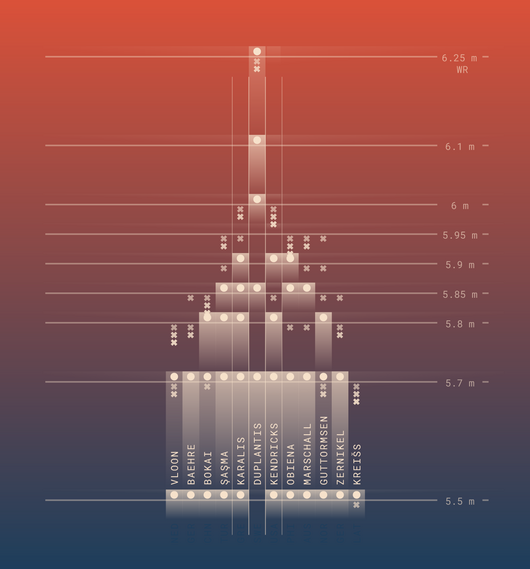
Vertical Momentum: High Jump & Pole Vault
은상Krisztina Szucs · 2024 · 여가, 게임, 스포츠
A good example of using animation to convey how a sporting event unfolds.
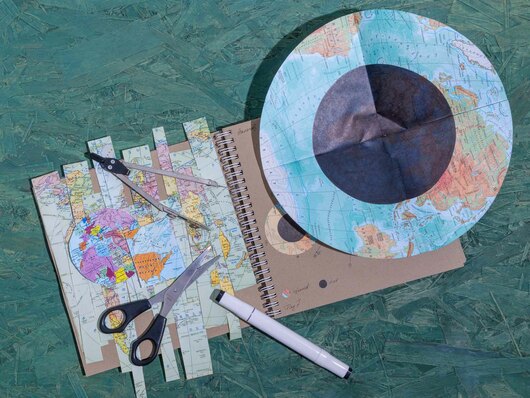
World in Tangible Fragments
금상Nadezda Andrianova · 2024 · 이색
It shows how data representation can be extended into physical materials.
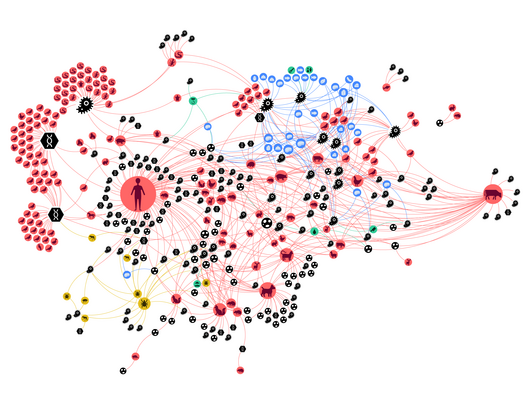
Zoonotic Web
금상Liuhuaying Yang · 2024 · 과학, 기술, 건강
A clear model for translating a scientific paper into a public-facing story plus an exploratory dashboard.
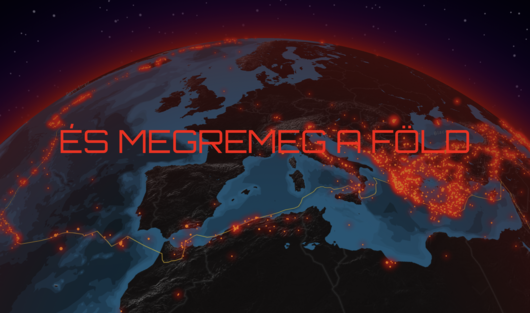
And the Earth shakes
은상Attila Bátorfy · 2023 · 인도주의
It shows how a timely event can open the door to a broader explanation.
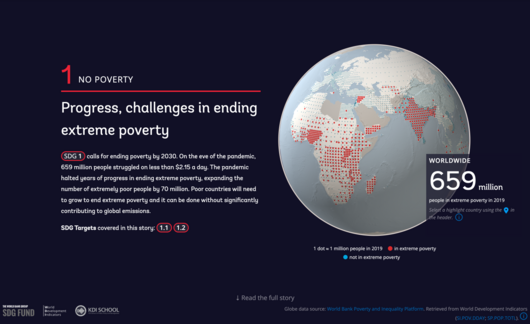
Atlas of Sustainable Development Goals 2023
금상World Bank · 2023 · 인도주의
A collaborative example of turning a vast set of indicators into one interactive narrative.

Boreal ablaze
동상Reuters · 2023 · 장소, 공간, 환경
It pairs a data trend with an explanation of the mechanism behind it.
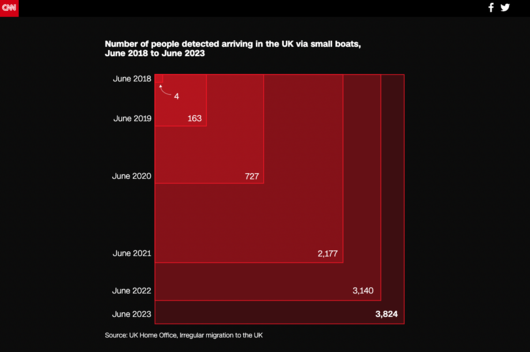
Britain’s shadowy border
금상CNN · 2023 · 시사와 정치
It shows how one transforming map can carry a story from overview to a single case.
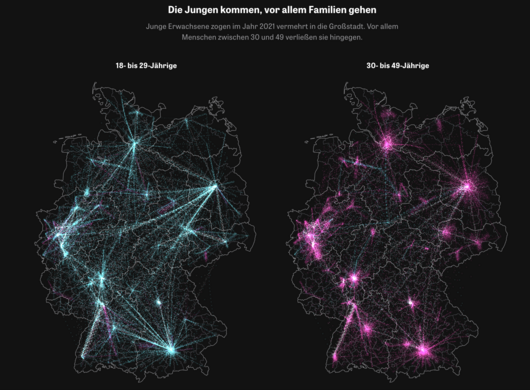
Die Stadtflucht / The Urban Escape
은상Zeit Online · 2023 · 시사와 정치
It demonstrates how a search entry point can turn a national dataset into a story each reader can find themselves in.
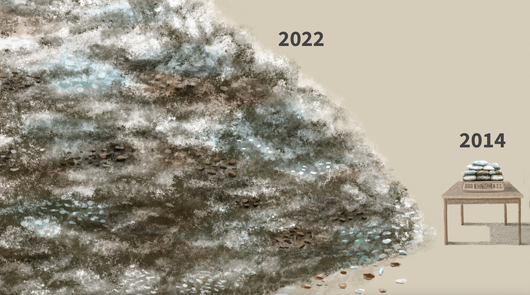
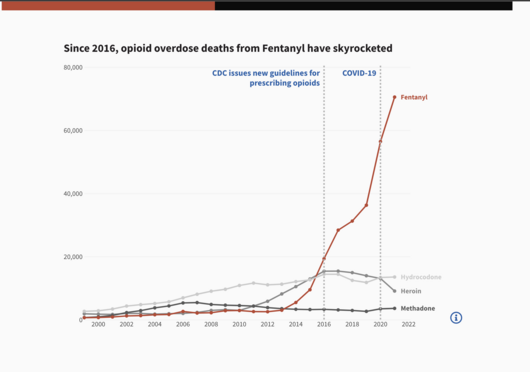
Fentanyl is fast, cheap and deadly
동상Reuters · 2023 · 인도주의
It shows how original data reporting and hand-drawn illustration can work together in one story.
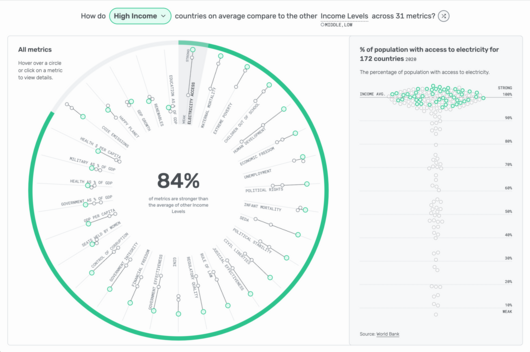
How do we compare?
금상Lindsey Poulter · 2023 · 비즈니스 분석
A good case study in dashboards that offer several ways in, from search to random exploration.
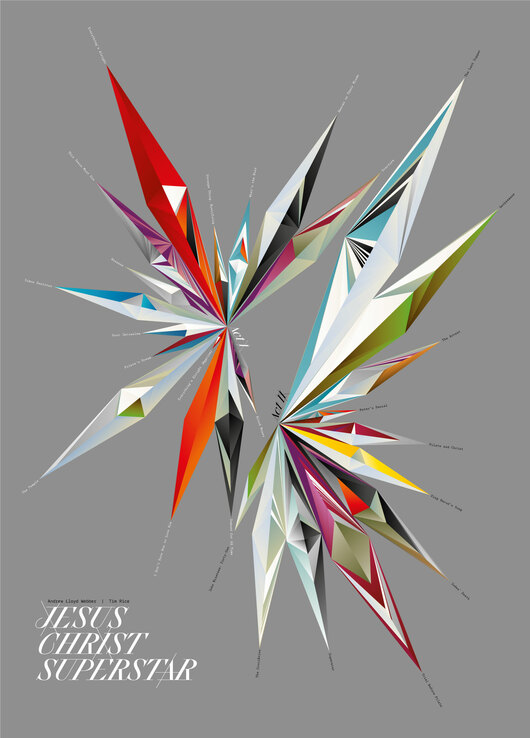
Jesus Christ Superstar
동상Nadezda Andrianova · 2023 · 예술, 엔터테인먼트, 문화
Useful for studying how a single poster can carry a data-based portrait of a creative work.

Journey into sleep
은상Reuters · 2023 · 과학, 기술, 건강
A clear case of combining illustration and information graphics to explain science to general readers.
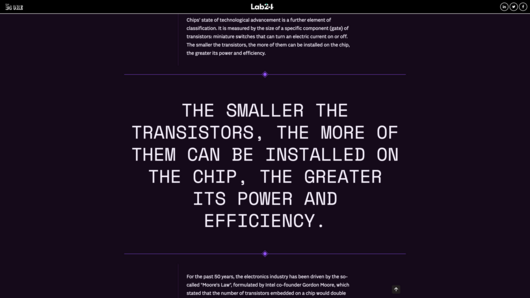
La Guerra dei chip
최종 후보Il Sole 24 Ore · 2023 · 과학, 기술, 건강
A good example of a longform structure that unpacks a complex industry through charts and prose.
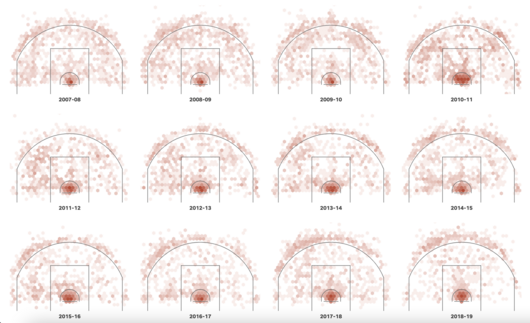
LeBron James has captured the scoring title. We visualized every shot.
금상USA Today · 2023 · 여가, 게임, 스포츠
It shows how shot-level data can carry the narrative of a sports news story.
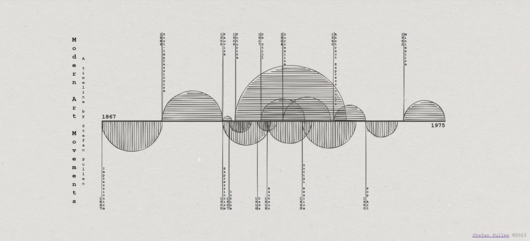
Modern Art Movements
은상stefan pullen · 2023 · 예술, 엔터테인먼트, 문화
A useful case for discussing when motion and aesthetics draw people into data and when they might overshadow it.
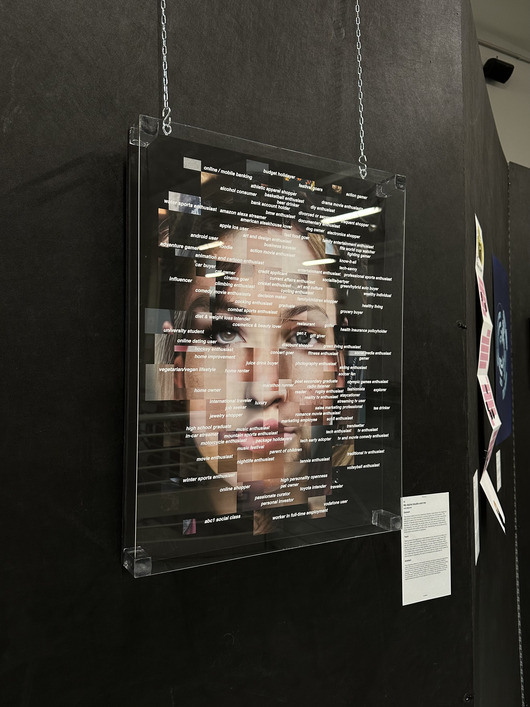
My digital double and me
은상Politecnico di Milano · 2023 · 이색
It shows how frequency can drive an image and how a human figure can make abstract data labels felt.

North Korea's missiles
동상Reuters · 2023 · 시사와 정치
It shows how a news graphic can pair an explanation of how something works with the historical record.
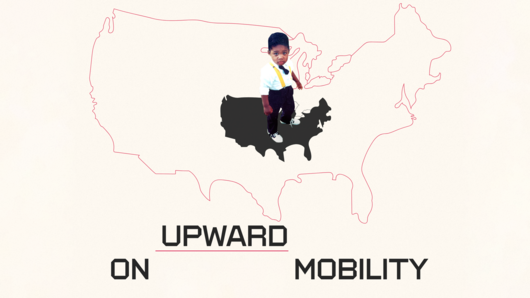
On Upward Mobility
금상Aaron Williams · 2023 · 사람, 언어, 정체성
A good example of how a historical design reference can give a data story its voice.
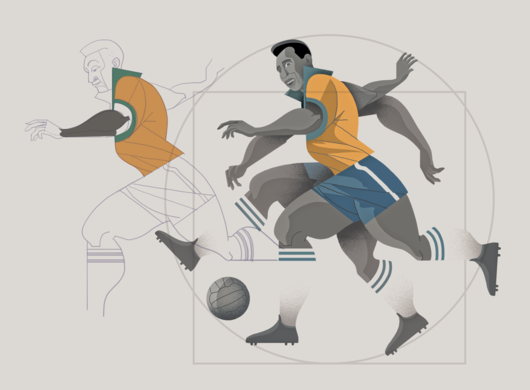
Football legend Pele’s greatest achievements
은상Victor Sanjinez · 2023 · 여가, 게임, 스포츠
It shows how illustration style and a comparative timeline can combine in a sports profile.
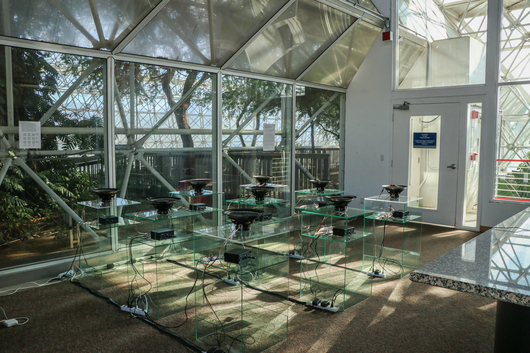
Ripple Effect
금상Dorsey Kaufmann · 2023 · 예술, 엔터테인먼트, 문화
A clear example of encoding data in physical, sensory form instead of on a screen.
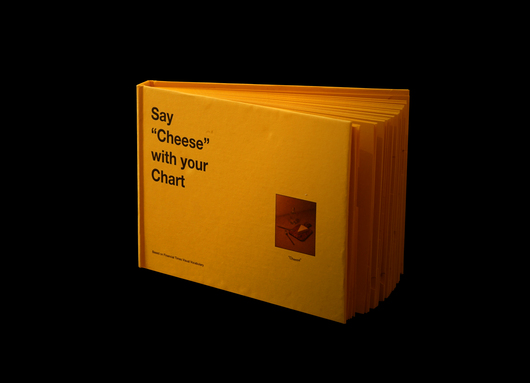
Say "Cheese" with your Chart
금상Webb Zhou and Xuwei Haung · 2023 · 이색
It shows how print design and a playful concept can make a chart reference approachable.

Screens Of August
동상NID Bangalore · 2023 · 여가, 게임, 스포츠
A compact example of translating a familiar stacked bar encoding into a tangible form.
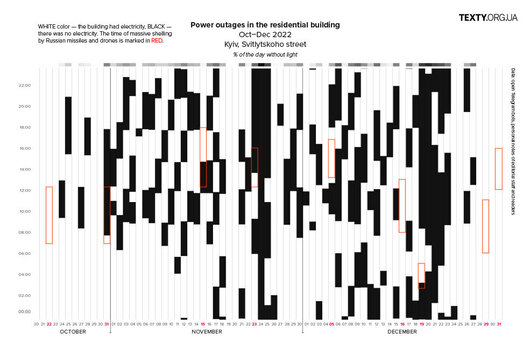
Shades of darkness
최종 후보Texty.org.ua · 2023 · 인도주의
It demonstrates how reader-sourced data can fill the gap when official figures are absent.
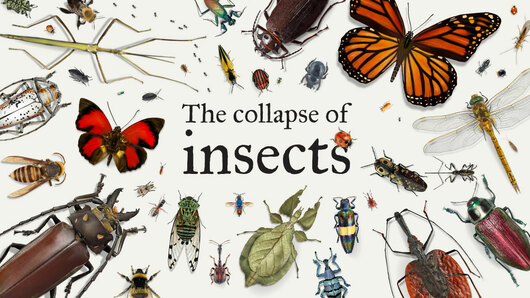
The collapse of insects
금상Reuters · 2023 · 장소, 공간, 환경
It shows how a well-chosen structure can make both scale and ignorance visible.
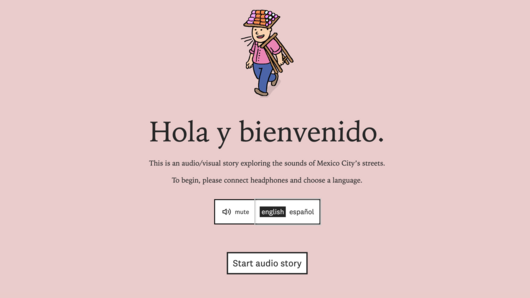
The Sounds of CDMX
은상Aaron Reiss and Oscar Molina Palestina · 2023 · 장소, 공간, 환경
A good example of giving visual form to something usually experienced by ear.
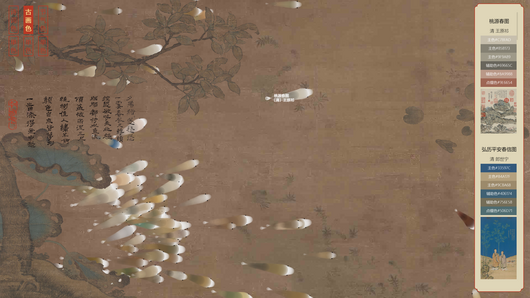
Traditional Chinese Color Libraries Browser
은상Zhejiang University · 2023 · 예술, 엔터테인먼트, 문화
It shows how a cultural metaphor can shape a visual form without giving up a tool's practical function.
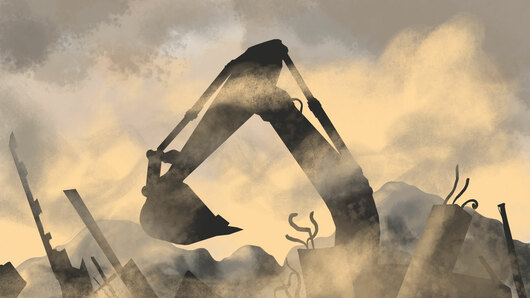
Turkey's toxic dust
금상Reuters · 2023 · 과학, 기술, 건강
It shows how visuals can support the argument of an investigative story.
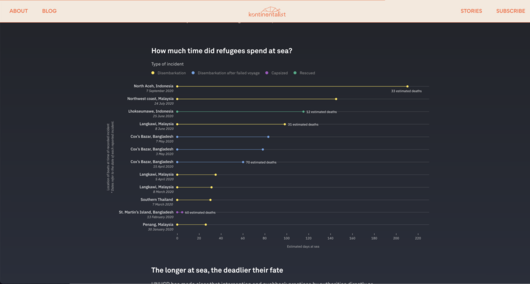
Abandoned at sea: The desperate journeys of Rohingya refugees
금상Kontinentalist · 2022 · 인도주의
It is a good example of combining audio, illustration and a map in a single narrative.
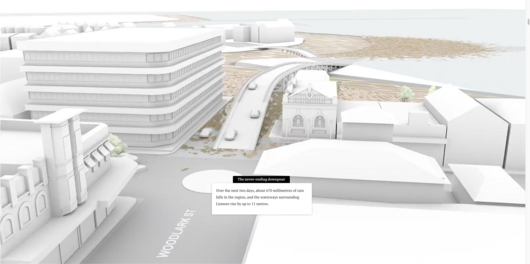
Anatomy of the Lismore disaster
금상the Sydney Morning Herald · 2022 · 장소, 공간, 환경
It shows how multiple media can be combined to reconstruct a disaster.
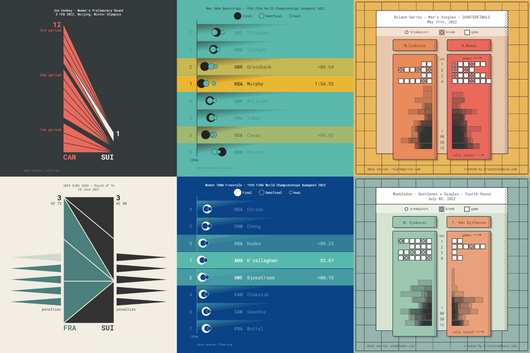
Animated Sport Results
은상Krisztina Szucs · 2022 · 여가, 게임, 스포츠
It teaches how to fit the visual form to the story of each sport.
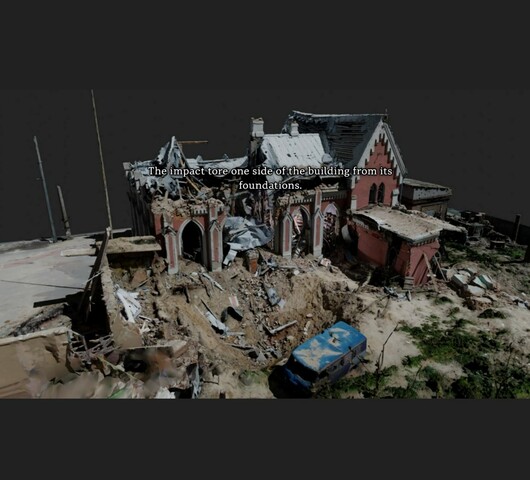
Culture in the Crosshairs
금상Australian Broadcasting Corporation · 2022 · 시사와 정치
A strong example of making massive 3D point cloud data accessible to ordinary readers on modest devices.
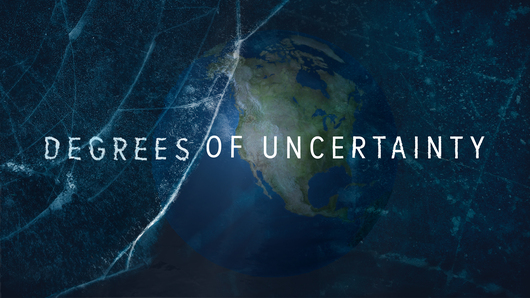
Degrees of Uncertainty
금상Andy Dollerson, Neil Halloran · 2022 · 과학, 기술, 건강
A good model for pacing a long time series through film so that a scientific argument unfolds step by step.

Gender and language
금상Reuters · 2022 · 사람, 언어, 정체성
A model of using illustration and animation to make an abstract social topic easy to follow.
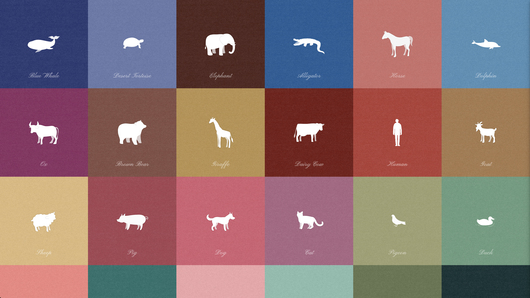
Heartbeats.
최종 후보SIORI KITAJIMA · 2022 · 장소, 공간, 환경
It shows how encoding a single value as rhythm and sound can make data feel personal.
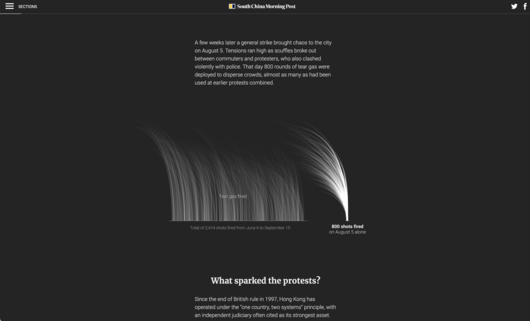
The first 100 days of protests rocking Hong Kong
은상South China Morning Post · 2022 · 시사와 정치
It shows how restrained, static explanatory graphics can carry a complex news story without interactivity.
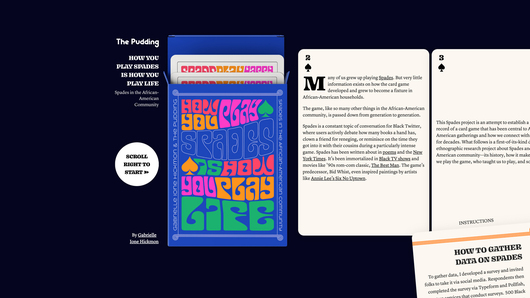
How You Play Spades is How You Play Life: Spades in the African-American Community
동상Gabrielle Ione Hickmon · 2022 · 여가, 게임, 스포츠
It demonstrates how community survey data can be delivered through both a digital story and a physical object.
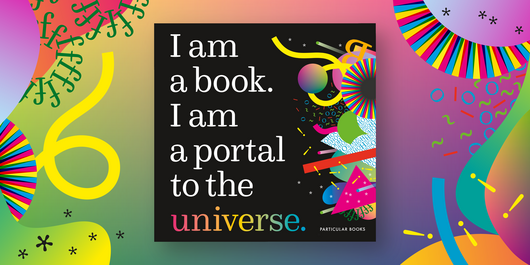
I am a book. I am a portal to the universe.
은상Stefanie Posavec, Miriam Quick · 2022 · 이색
It shows how the physical properties of a medium can themselves encode data.
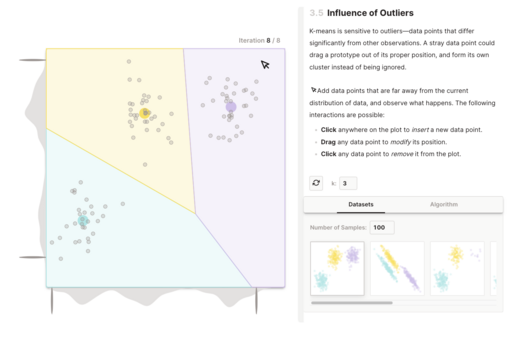
K-Means Clustering: An Explorable Explainer
은상Yi Zhe Ang · 2022 · 과학, 기술, 건강
It shows how to introduce controls step by step so that readers build understanding through hands-on play.
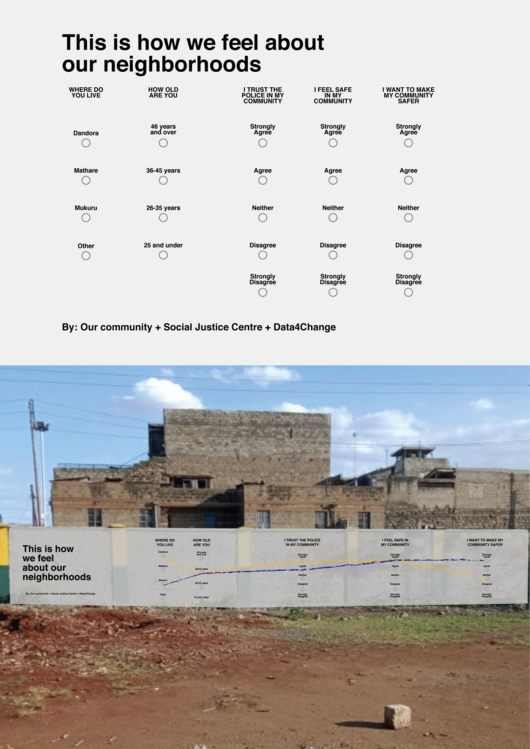
Life under curfew
금상Social Justice Centre Working Group · 2022 · 이색
It demonstrates how data visualization can invite a community to participate in and own its data.
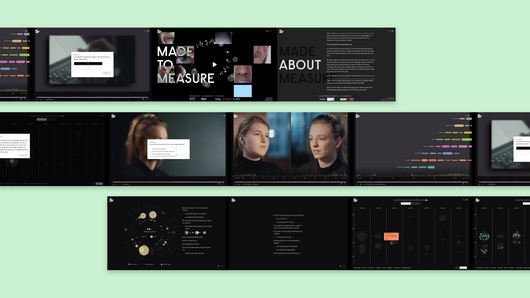
Made to Measure
금상Group Laokoon, Kulturstiftung des Bundes, Studio NAND · 2022 · 예술, 엔터테인먼트, 문화
It is a strong example of visualization driving both narrative and viewer participation.
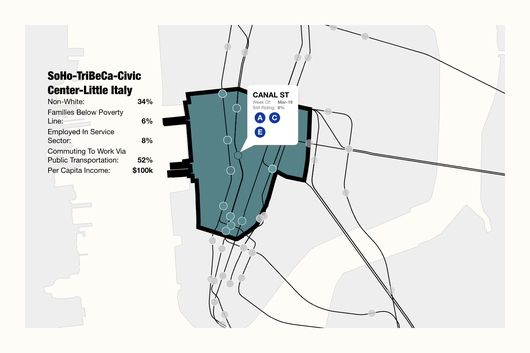
MTA Ridership Changes due to Covid-19
금상TWO-N Inc. · 2022 · 2022 특별 부문: 코로나19 시각화
It shows how one familiar system can anchor a story about inequality in a crisis.
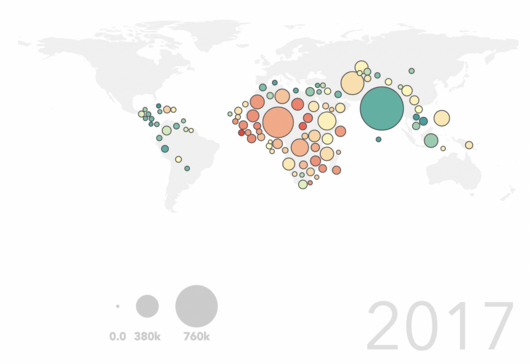
Precision mapping to end child deaths
최종 후보Insitute for Health Metric · 2022 · 과학, 기술, 건강
A clear case of turning a research paper into an accessible scrolling story.
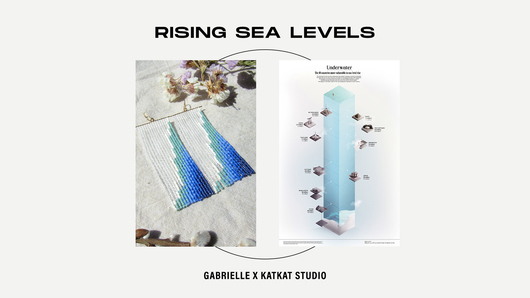
Rising Sea Levels
최종 후보Gabrielle Merite · 2022 · 인도주의
It shows how a data story can be carried by a crafted object rather than a standard chart.
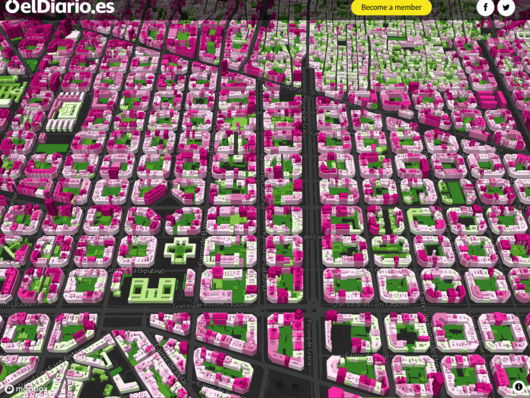
Spain lives in flats: why we have built our cities vertically
동상elDiario.es · 2022 · 장소, 공간, 환경
It shows how a small-to-large scrolling story and heavy geospatial data processing can work together.
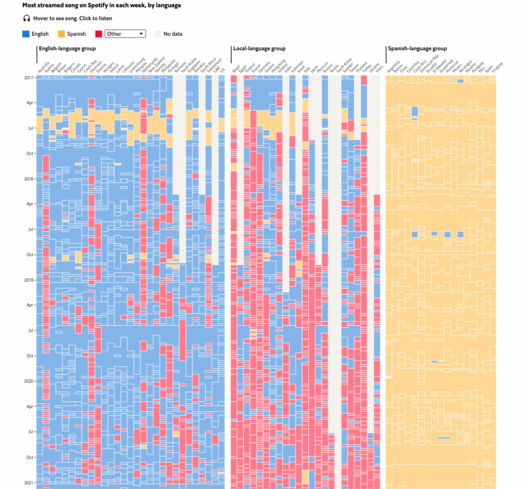
What Spotify data show about the decline of English
은상The Economist · 2022 · 예술, 엔터테인먼트, 문화
It shows how a large dataset can be simplified for exploration while adding the experience of listening.

Sternenhimmel der Menschheit
최종 후보Figures CC · 2022 · 예술, 엔터테인먼트, 문화
It shows how a visualization tool can be extended into rich content and a physical event setting.
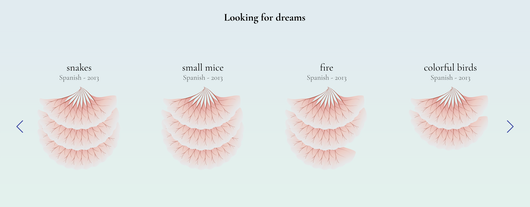
The Shape of Dreams
동상Alberto Cairo, Federica Fragapane, Paolo Corti, Simon Rogers · 2022 · 사람, 언어, 정체성
It shows how everyday search data can become an expressive visual subject.

Thunder Roads
금상Joey Cherdarchuk · 2022 · 여가, 게임, 스포츠
A useful example of turning one sporting season into a series of interactive views.
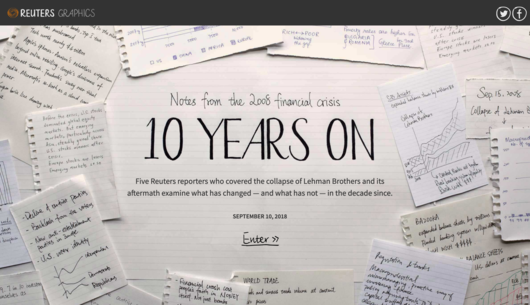
10 Years On
금상Reuters · 2019 · 시사와 정치
A good example of framing a decade-long story as a retrospective.
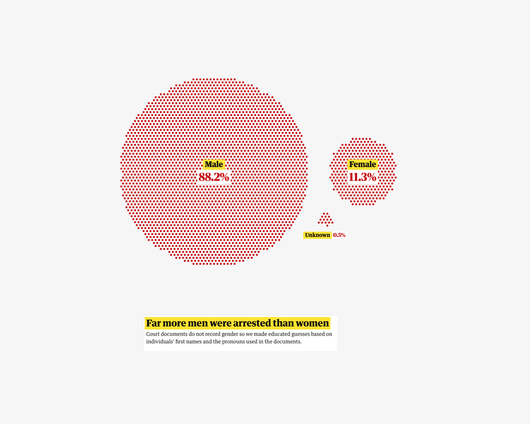
3,121 Desperate Journeys: Exposing A Week Of Chaos Under Trump's Zero Tolerance
동상The Guardian · 2019 · 인도주의
It shows how illustration can balance raw data in a sensitive story.

A View On Despair
금상Sonja Kuijpers - Studio Terp · 2019 · 사람, 언어, 정체성
It shows how a metaphorical landscape can carry a painful dataset with care.
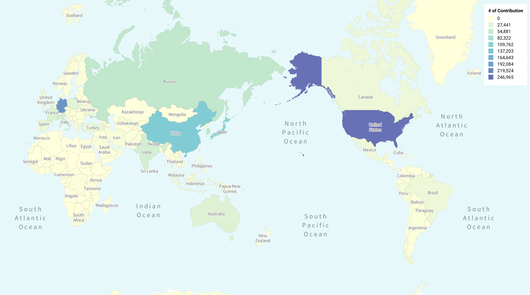
Cartographers Of North Korea
금상Wonyoung So, Massachusetts Institute of Technology · 2019 · 장소, 공간, 환경
It shows how data analysis and interviews together can answer a question about people behind a map.

Codex Atlanticus
금상The Visual Agency · 2019 · 예술, 엔터테인먼트, 문화
It shows how overview, filtering and re-sorting can make a large archive explorable.
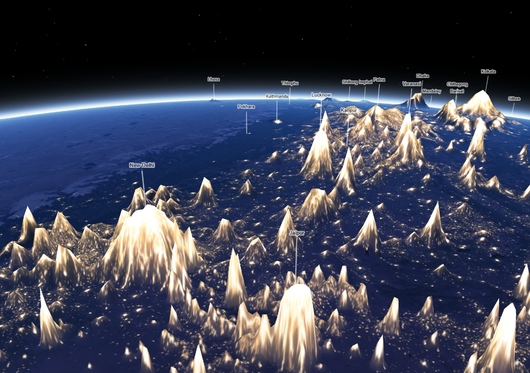
Earth At Night, Mountains Of Light
금상Jacob Wasilkowski · 2019 · 장소, 공간, 환경
A good example of how an unexpected encoding choice can make familiar data feel new.
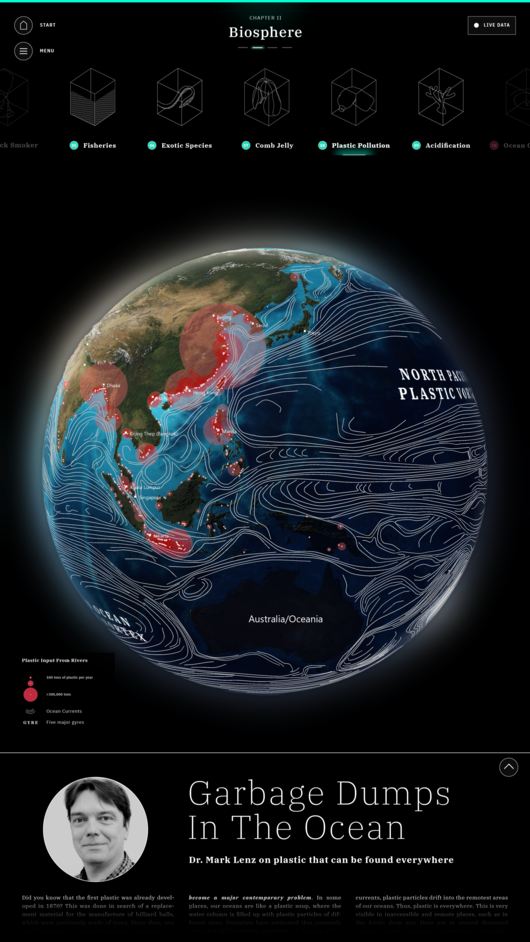
Explore The Ocean – Interactive Scientific Poster
금상Science Communication Lab · 2019 · 과학, 기술, 건강
It shows how to organize deep scientific content into approachable chapters for a touch-screen audience.
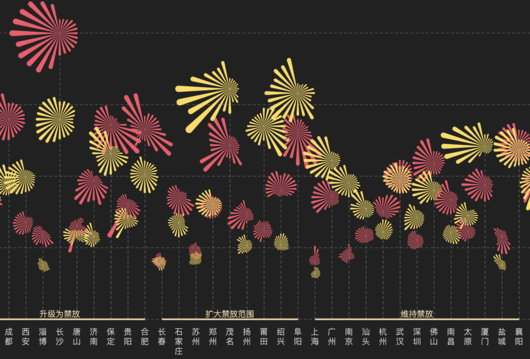
Fewer Fireworks For Celebration, Better Air Quality To Start The New Year
최종 후보ThePaper.cn · 2019 · 시사와 정치
It demonstrates how a metaphor-driven chart can be adapted thoughtfully for phone, desktop and print.
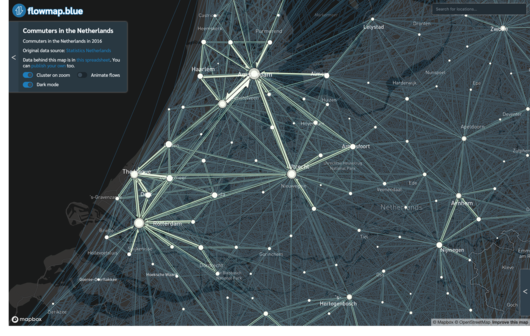
Flowmap.blue
동상Ilya Boyandin · 2019 · 시각화와 정보 디자인
A good example of how one well-chosen chart form can be packaged as a reusable tool for many kinds of movement data.
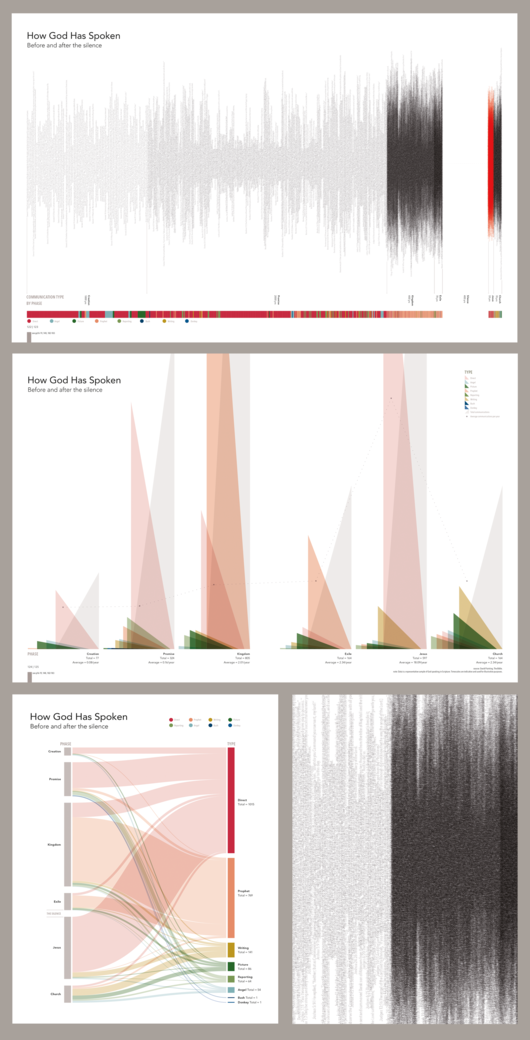
How God Has Spoken: Before And After The Silence
동상Karen Sawrey · 2019 · 예술, 엔터테인먼트, 문화
It shows how a well-chosen visual metaphor can make an absence in the data visible.
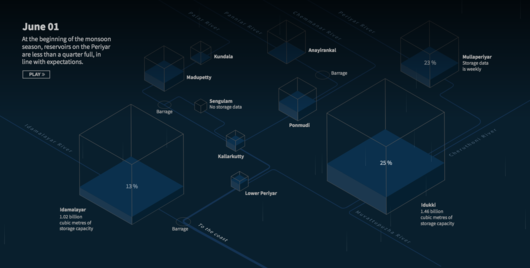
How Kerala’s Dams Failed To Prevent Catastrophe
금상Reuters · 2019 · 시사와 정치
A good example of explaining a single cause of a large disaster through a sequence of focused graphics.
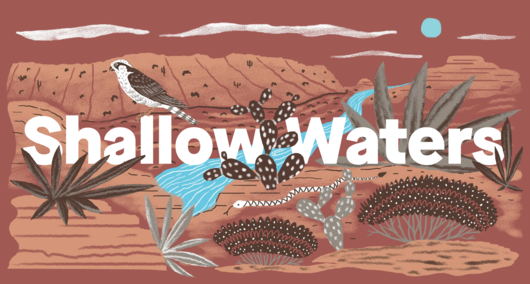
In A Warming World, The Fight For Water Can Push Nations Apart - Or Bring Them Together
최종 후보Quartz and The Texas Observer · 2019 · 장소, 공간, 환경
It shows how a global figure can be anchored to a concrete human and political stake.
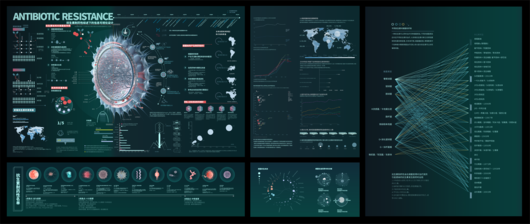
Information Visualization Design Under The Overview Of Antibiotic Resistance
최종 후보Fan Mingyao, Nanjing University Of the Arts · 2019 · 과학, 기술, 건강
A student example of structuring a health topic as cause, consequence and effect.
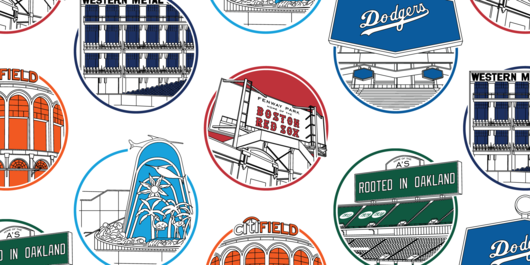
The Irregular Outfields Of Baseball
동상The DataFace · 2019 · 여가, 게임, 스포츠
It shows how classification can bring order to a set of irregular shapes.

Live BMX Data Visualization
금상CLEVER°FRANKE · 2019 · 여가, 게임, 스포츠
It shows how sensor data can be translated into a visual metaphor that fits the sport.
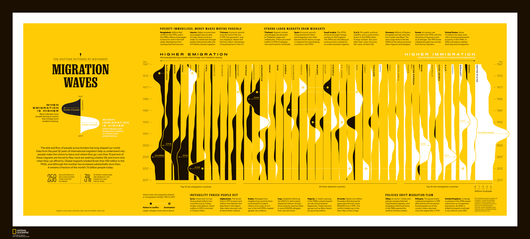
Migration Waves
금상National Geographic · 2019 · 사람, 언어, 정체성
It shows how a visual metaphor can tie a subject to its publication context.
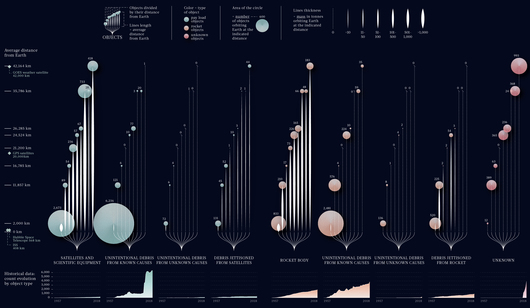
Space Junk
최종 후보Federica Fragapane · 2019 · 과학, 기술, 건강
It shows how several variables can sit together in one carefully organized editorial composition.

The History Of The Forbidden City: A Visual Explainer
은상South China Morning Post · 2019 · 예술, 엔터테인먼트, 문화
It shows how mixed media can turn architecture and history into one coherent story.
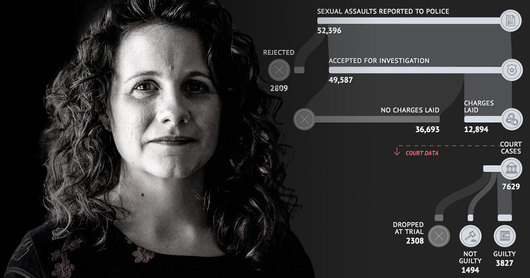
The Invisible Crime: Are We Failing Victims Of Sexual Violence?
금상The Age, the Sydney Morning Herald · 2019 · 인도주의
A model of grounding a sensitive story in numbers without losing the people behind them.
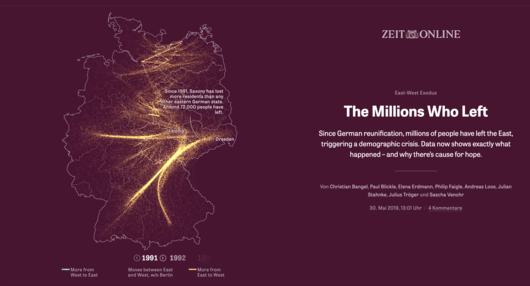
The Millions Who Left
은상Zeit Online · 2019 · 시사와 정치
It shows how a decades-long demographic trend can be told as a clear data story.
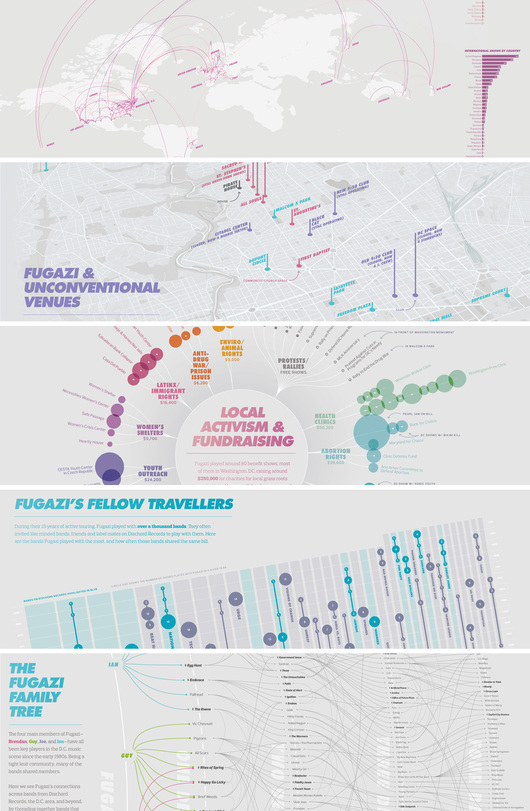
Visualizing The History Of Fugazi
금상Carni Klirs, Maryland Institute College of Art · 2019 · 예술, 엔터테인먼트, 문화
A strong example of turning a band's own archive into a print-based story.
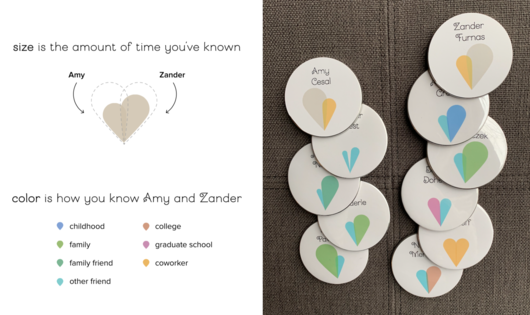
Wedding Data Viz: How We Designed For Feelings
은상Amy Cesal, Zander Furnas · 2019 · 이색
A good case for discussing design choices that favor feeling over precise comparison.
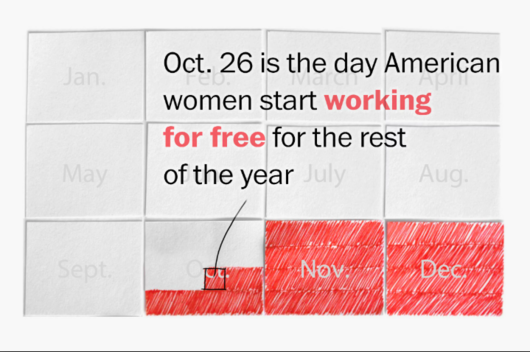
Oct 26, the day women start working for free
최종 후보Xaquín González Veira · 2018 · 사람, 언어, 정체성
A clear lesson in making one statistic tangible by changing the unit it is expressed in.