Screens Of August
동상Bronze익숙한 누적 막대 인코딩을 물리적 형태로 옮기는 방법을 간결하게 보여 줍니다.A compact example of translating a familiar stacked bar encoding into a tangible form.
Screens Of August는 NID Bangalore에서 만든 촉각적 데이터 시각화로, 2022년 8월 한 달간 한 사람의 휴대폰 사용 시간을 기록했습니다. 그 달은 학기 중간 방학과 다음 학기 시작이 정확히 반씩 나뉘어 있었습니다. 앱 종류별로 휴대폰 사용 패턴을 기록하는 것이 목적이었습니다.
Screens Of August is a tangible data visualization from NID Bangalore that records one person's phone screen time across August 2022. The month was split evenly between a semester break and the start of the next semester. The aim was to record phone usage patterns by type of app.
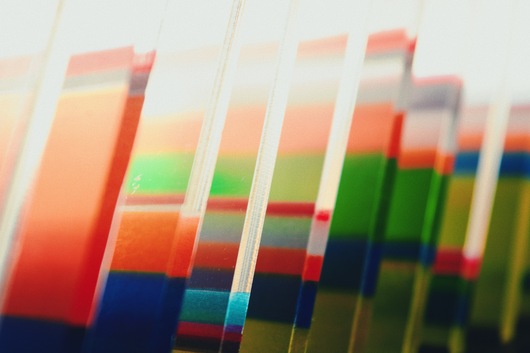
모든 앱을 9개 범주로 나누고 범주별로 사용 시간을 합산했습니다. 하루는 카드 모양의 아크릴 한 장으로 표현하며, 누적 막대 형태의 선 그래프로 범주별 사용 시간을 보여 줍니다. 개인 데이터를 다루면서 누적 막대 인코딩을 물리적 오브젝트로 옮긴 프로젝트로 살펴볼 만합니다.
All apps were sorted into 9 categories, and time was summed per category. Each day is a card-like acrylic piece, and a stacked line bar graph on it shows the time spent in each category. It is worth studying as a personal data project that turns a stacked bar encoding into a physical object.