Live BMX Data Visualization
금상Gold센서 데이터를 종목에 어울리는 시각적 은유로 바꾸는 법을 보여 줍니다.It shows how sensor data can be translated into a visual metaphor that fits the sport.
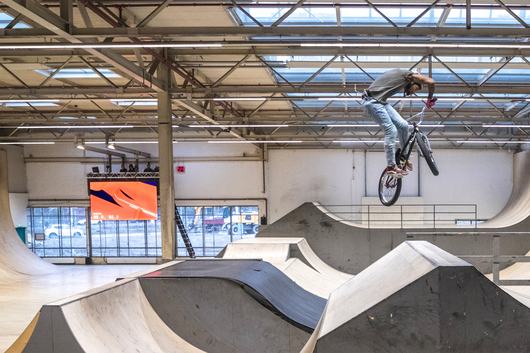
CLEVER°FRANKE가 네덜란드 사이클링 연맹의 의뢰로 만든 프리스타일 BMX 라이브 데이터 시각화입니다. 더 많은 사람에게 이 종목의 매력을 알리고자 현장 관중과 심사위원을 대상으로 했습니다. 센서로 선수의 연기를 추적한 최초의 BMX 챔피언십 실시간 시각화입니다.
This is a live data visualization of Freestyle BMX by CLEVER°FRANKE, made for the Royal Dutch Cycling Federation. It was meant to draw more people to the sport, aimed at live spectators and jury members. Sensors tracked the rider throughout each performance, making it the first live data visualization of a BMX championship.
선수의 움직임을 화면에 타이어 자국 모양으로 그리며, 속도에 따라 점선 간격이 좁거나 넓어지도록 했습니다. 네덜란드 선수권대회라는 점에서 주황색을 핵심 색으로 썼습니다. 센서 데이터를 스포츠의 이미지에 맞는 은유로 바꾸어 현장에서 바로 읽히게 한 점이 배울 만합니다.
The rider's path is traced on screen as a tire track print, with dash patterns that sit closer together or farther apart depending on speed. Orange serves as the key color because this was the Dutch National Championships. It is a useful study in turning sensor data into a metaphor that suits the sport and reads instantly for a live audience.
제작Credits
Creative Director: Thomas Clever, Gert Franke; Designer: Roel de Jonge, Joost Mommers; UX Designer: Joe Chrisman, Wouter van Dijk; Creative Development: Wilco Tomassen; Sensor data: Urban Sports Performance Centre