How do we compare?
금상Gold검색부터 무작위 탐색까지 여러 진입 방식을 제공하는 대시보드 설계를 공부하기에 좋은 사례입니다.A good case study in dashboards that offer several ways in, from search to random exploration.
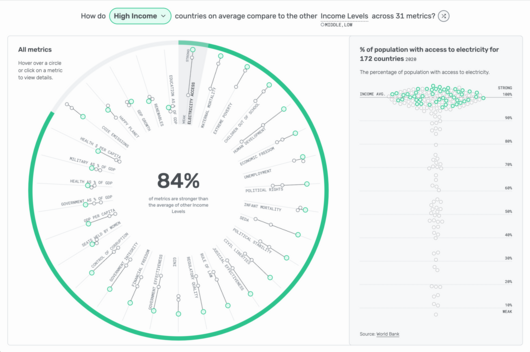
린지 폴터(Lindsey Poulter)가 만든 인터랙티브 대시보드로, 국가, 지역 또는 소득 수준 하나를 골라 다양한 지표에서 비슷한 대상들과 어떻게 비교되는지 살펴볼 수 있습니다. 세계 곳곳의 진전을 이끌고 측정하는 데 도움이 되도록 World Data Viz Prize를 위해 제작되었습니다.
Lindsey Poulter's interactive dashboard lets users pick a country, region or income level and see how it compares with its counterparts across a wide range of metrics. It was created for the World Data Viz Prize, with the aim of helping drive and measure progress around the world.
사용자는 국가를 검색하거나, 셔플 버튼으로 무작위 대상을 고르거나, 툴팁을 통해 선택을 바꿀 수 있습니다. 하나의 대상을 중심에 두고 비슷한 대상과 비교하는 구성은 다양한 진입 경로를 갖춘 대시보드 설계의 좋은 본보기입니다.
Users can search for a country, press a shuffle button to select a random focus, or change the selection through tooltips. Centering the view on one chosen subject and comparing it with peers gives students a clear model for dashboard design built on flexible entry points.