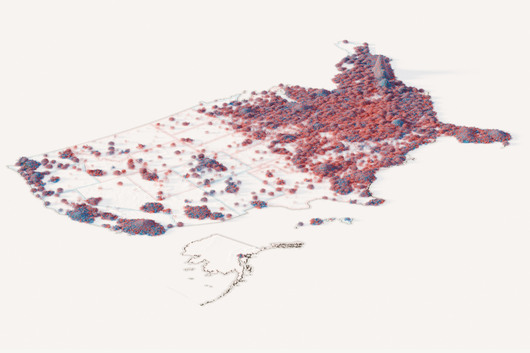
How the 2024 U.S. election was decided, vote by vote
은상Silver표 하나하나를 입자로 바꿔 규모와 분포를 동시에 보여주는 발상이 돋보이는 사례입니다.It shows how mapping each unit as a particle can convey scale and distribution at once.
워싱턴 포스트(The Washington Post)가 2024년 미국 대선 결과를 모래알로 표현한 3차원 지도 프로젝트입니다. 투표 1억 6천만 표를 모래알 하나하나로 나타내, 단순한 빨강과 파랑 지도보다 섞여 있고 서로 연결된 미국의 모습을 보여주려 했습니다.
The Washington Post built a three-dimensional map of the 2024 U.S. presidential election in which grains of sand stand for votes. By showing all 160 million votes, it tries to portray a country more mixed and interconnected than red-and-blue maps suggest.
Blender로 수백만 개의 입자를 시뮬레이션해 각 입자가 한 표를 나타내게 했고, QGIS로 지리 데이터를 처리해 표의 위치를 정확히 잡았습니다. 개별 표를 지형처럼 쌓아 올리는 방식이어서, 숫자 규모와 지역별 분포 패턴을 함께 전달하는 표현을 연구하기에 좋습니다.
Blender simulated millions of particles, each one a single vote, while QGIS handled the geographic data so votes landed in the right places. Turning individual votes into a topography conveys both scale and regional pattern, which makes it worth studying for unconventional map encodings.
제작Credits
Tim Meko, Aaron Steckelberg, Leslie Shapiro, Adrián Blanco Ramos, Sarah Frostenson, Manuel Canales and Jordan Melendrez