Life under curfew
금상Gold데이터 시각화가 공동체의 참여와 소유를 이끌어 내는 방법을 보여 주는 사례입니다.It demonstrates how data visualization can invite a community to participate in and own its data.
「Life under curfew」는 케냐 나이로비의 비공식 정착촌 단도라 주민들이 주민을 위해 만든 참여형 데이터 경험입니다. 제작은 Social Justice Centres Working Group이 맡았습니다. 2020년 코로나19 봉쇄 시기의 통행금지 아래에서 일어난 체포, 부상, 사망과 공동체의 연대를 주민에게 다시 돌려주려는 프로젝트입니다.
"Life under curfew" is a participatory data experience made by and for residents of Dandora, an informal settlement in Nairobi, Kenya, by the Social Justice Centres Working Group. It deals with arrests, injuries and killings during the 2020 Covid-19 curfews, as well as the solidarity the community showed. The aim was to bring the survey data back to the people it describes.
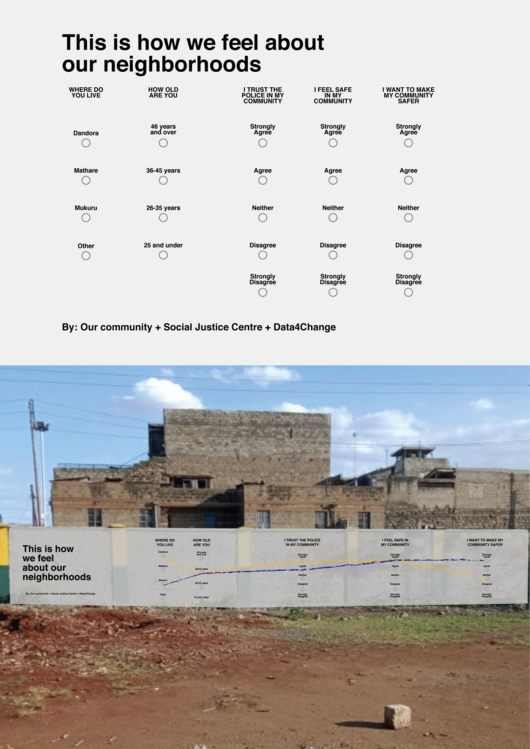
2021년 11월 Data4Change와 함께 연 행사에서 세 점의 참여형 벽화를 만들었습니다. 한 벽화에서는 참가자가 도움 받은 대상을 상징으로 그렸고, 다른 벽화에서는 설문 응답을 종이에 선으로 이은 뒤 성별 정체성에 따라 색이 다른 밧줄을 벽에 박은 데이터 지점 사이에 걸었습니다. 80명 넘는 참가자가 자신의 데이터를 직접 시각화했고, 연령대와 지역별 이웃에 대한 감정 패턴이 드러났습니다. 데이터를 화면이 아닌 공공 벽면과 물리적 참여로 전달한 점이 주목할 만합니다.
At a November 2021 event with Data4Change, three participatory murals were created. On one, people painted symbols for who had helped them; on another, they traced survey answers on paper and then strung colored ropes, chosen by gender identity, between data points nailed to the wall. More than 80 people visualized their own data, and the strings revealed patterns by age group and area. The work is notable for putting data on a public wall and making the audience part of the encoding.
제작Credits
Stephen Kinuthia Mwangi, The Social Justice Centre Working Group, Kenya
Antony Adoyo, The Social Justice Centre Working Group, Kenya
Happi Olal, The Social Justice Centre Working Group, Kenya
Richie Uchenna, data analyst, Nigeria
Frenny Jowi, journalist, Kenya
Surasti Puri, designer, UK
Evelina Judeikyte, Data4Change, France